|
|
|
|
Dennis J. Martin |
Radio
World User Report |
|
SOUND TECHNOLOGY REVEALS AUDIO SPECTRUM by Dennis J. Martin LOS ANGELES An
oscilloscope is a valuable instrument for displaying the time domain
(amplitude vs. time) characteristics of a signal. In audio work, however, the
frequency domain (amplitude vs. frequency) is often more important and
revealing. For that task, spectrum analysis is needed. Although real time
analyzers (RTA’s) have been available in slightly
different forms for years, many have been cost prohibitive. That's where your
PC can help. SpectraRTA software, from
Sound Technology, transforms your PC and sound card into a dual channel, real
time spectrum analyzer. Many analog RTAs merely
provide a spectral display and perhaps a pink noise output. But SpectraRTA
surpasses RTA’s of the past by adding THD
measurement capability, and a signal generator utility that produces a
variety of test signals. Behind the scenes . . . SpectraRTA
uses the PC's sound card to perform an analog to digital conversion of the
input signal. Once digitized, a Fast Fourier Transform (FFT) math algorithm
produces the frequency domain based signal. This marks a departure from
traditional analyzers that use analog filters. Although ISO standard center
frequencies and bandwidths have been preserved, FFT emulated filters have
steeper "skirts." As a result, performance often exceeds that of
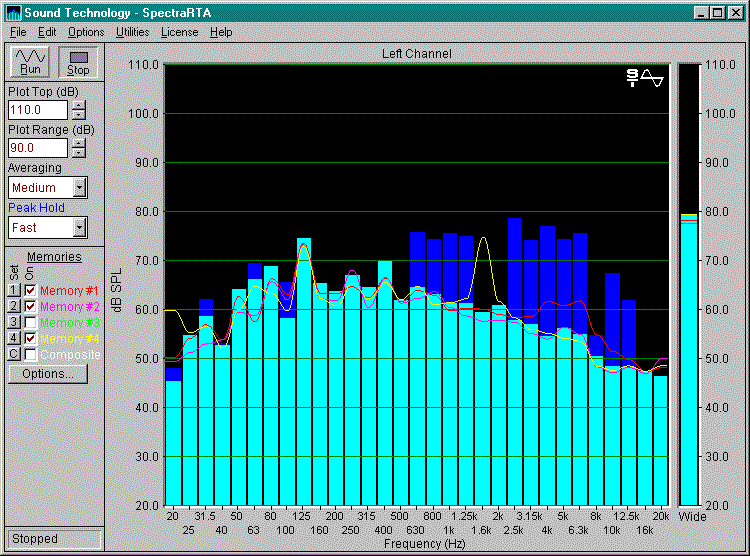
analog filters. The measurement spectrum is depicted
as a typical two dimensional bar or line plot: the x-axis is frequency in Hz,
and the y-axis is amplitude in dB. Resolution of the x-axis is 1, 1/3, or 1/6
octave. Frequency span, or bandwidth, is adjustable from a low of 16, 31, 63,
or 125 Hz, to a high of 4, 8, or 16 kHz in 1 octave mode; and from 20, 40,
80, or 160 Hz, to 5, 10, or 20 kHz in 1/3 and 1/6 octave modes. The minimum
amplitude range is 10 dB, and the maximum is 200 dB; a movable cursor reads
the level in each frequency band to 0.01 dB. And an indicated wideband signal
level may be used for sound pressure level (SPL) measurements. SpectraRTA offers six
processing modes: Left channel only; right only; left and right (a
two-channel display); left + right (a sum of the two); left - right; and
right - left. Besides flat, three standard weightings can be individually
applied to the spectrum and wideband displays: A, B, and C. Custom weightings
and microphone compensation tables can be designed by merely creating ASCII
text files. Averaging is an important
function in an RTA, and five choices are available: Off, Fast, Medium, Slow,
and Forever. Fast displays a running average that is computed with a 40
dB/sec decay rate; Medium with a 20 dB/sec rate; Slow with
4 dB/sec; and Forever accumulates data until the RTA function is
stopped. Off and Fast are useful in analyzing discrete tones and program
material or other transient signals, while Slow or Forever is a must when
working with pink noise. A separate, second display is
Peak Hold, indicated on-screen by a different color. This feature is
invaluable in recording the highest amplitude in each frequency band. Peak
hold can be disabled (Off); set to hold and display the peak for 1 second
(Fast); 5 seconds (Medium); 10 seconds (Slow); or as long as the RTA is
operating (Forever). Total recall . . . Measured data
can be printed, copied to the Clipboard and transferred to another
application, or saved directly to hard disk or in one of four memory
locations. The amount of data saved is limited only by available hard disk
space. Each memory can be separately labeled, level offset, and saved to and
loaded from disk as ASCII text. A composite memory builds a trace by
averaging or subtracting any of the four memories selected. Saved spectral
plots can be recalled for comparison or analysis, displayed as limits, or
printed. Up to four memories and one composite memory can be viewed
on-screen. The signal generator function
of SpectraRTA produces white noise (equal energy at all frequencies); pink
noise (equal energy per octave); a 1 kHz sine wave for level calibration and
distortion measurements; up to ten simultaneous tones for complex multi-tone
testing, the frequency and level of which can be individually adjusted; a
linear or log frequency sweep; and a level sweep. Sweep times and start and
stop limits are user definable. As you might expect,
measurement accuracy is dependent upon sound card performance. Frequency
tolerance, which relies upon the sampling clock on the sound card, is usually
within a fraction of a Hz. Amplitude accuracy and THD can vary widely--we
measured the sound card supplied in a Compaq Presario 9660 and found it to be
about -2.1 dB at 20 Hz, -6.6 dB at 16 kHz, and -34.5 dB at 20 kHz; THD at 1
kHz and -10 dBFS was 0.077% left and 0.365% right.
We flattened the response of this card somewhat by creating a custom
compensation file. Professional quality sound
cards, however, include balanced analog inputs and outputs and are typically
flat within 0.2 dB; THD can be <0.0025%. Theoretical dynamic range is 48
dB for an 8-bit sound card, and 96 dB for a 16-bit. Also, inexpensive sound
cards are simplex--they cannot generate and measure simultaneously. In
contrast, most pro cards are duplex and thus allow concurrent signal
generation and measurement of data to very exacting standards. Unveiling the spectrum . . . The RTA mode
is useful for measuring the response of virtually anything using discrete
tones, a swept sine wave, or pink noise. We checked an entire audio chain,
including processing, using pink noise. We checked an entire audio chain,
including processing, using pink noise. Or, analyze the spectrum of an
off-air signal on a real-time basis. The most impressive feature
we've found is the Room Response mode. We believe it's mislabeled because it
is a transfer function that has applications far beyond acoustic room
response. Basically an L-R (or R-L) derived signal, it is a highly sensitive
feature that dynamically highlights subtle differences between two sources.
We measured the real-time record/play response of a three-head cassette deck
using pink noise--the output of the cassette deck fed SpectraRTA's
right input and the pink noise generator fed the left input. Using program material, you
can instantly evaluate an entire system such as an air chain, or a single
element like a satellite feed. Since it is unnecessary to set a reference
level or transmit wideband noise or multiple tones, you can continuously
monitor performance without interruption. And, because it is a difference function,
frequency response errors of the sound card are mostly canceled. Hardware requirements are
modest: a 386 or higher CPU with math coprocessor, 8 MB RAM, 4 MB hard disk
space, VGA monitor, sound card, and mouse or other pointing device.
SpectraRTA is a 32-bit application optimized to run under Microsoft Windows
95 or Windows NT, and is compatible with Windows 3.1x + Win32s. You can
download an evaluation copy from their Web side at www.soundtechnology.com. Sound Technology's SpectraRTA
software, a PC, and a sound card provide measurement capability that was once
largely unobtainable. And it moves the engineer one step closer to measuring
what he can hear. * * * |
SpectraRTA132 Software
PC Based Test - Acoustic Real Time Analyzer -
Sound/Program Monitor
Native 32-Bit
Win95/98/ME/NT/2000
Supports up to
24-bit/192kHz precision
Octave
Analyzer with joint average versus peak spectrum views.
Narrow-band
Analyzer (up to 32K FFT)
Digital
Meters (i.e. THD, IMD, SNR, SINAD, NF, W&F, SPL, Peak Amp/Frequency)
VU Meter
(Left, Right, Left/Right).
Stereo
Image Scope/Stereo Phase Scope
System
Transfer Functions and Coherence
Reverberation/Decay
Processing & Analysis
Delay
Finder
Hi-Definition
Audio Digital Recorder
Spectral
and Wideband Filters (ANSI A, B, C)
Microphone/Transducer
Compensation
Signal
Generation
DDE-Dynamic
Data Exchange/Data Logging
plus much
more…